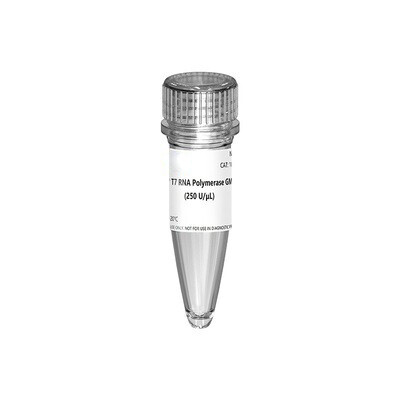
T7 RNA Polymerase GMP-grade (250 U/μL) 10KU
This product is a bacteriophage T7 RNA polymerase derived from recombinant protein expression in Escherichia coli. It catalyzes the 5'→3' synthesis of RNA on double-stranded DNA from its T7 promoter sequence (5'-TAATACGACTCACTATAG*-3') and uses NTPs as substrates. The DNA with double-stranded linear blunt ends or 5'protruding ends can be used as templates for T7 RNA polymerase, so linearized plasmids and PCR products can be used as templates for in vitro synthesis of RNA.
Note: G* is the first base of the RNA transcript.
This product is produced in accordance with GMP regulations and provided in liquid form.
Feature
- Synthesize long transcripts and short transcripts, RNA can be produced 100-200 μg with 1 μg of DNA template
- Higher yield and easy to operate
- Lower endotoxins
- Tested for the absence of endonucleases, exonucleases, RNases
Application
- Radiolabeled RNA probe preparation
- RNA generation for studies of RNA structure, processing and catalysis
- Expression control via anti-sense RNA
- mRNA, sgRNA synthesis
Specification
| Source | Expressed in E. coli with a recombinant T7 RNA Polymerase gene |
| Optimum Temperature | 37℃ |
| Storage Buffer | 50 mM Tris-HCl, 1 mM EDTA, 10 mM DTT, 100 mM NaCl, 0.1% Triton X-100,50% (v/v) glycerin,pH7.9 at 25℃ |
| Unit Definition | The amount of enzyme required to incorporate 1 nmol of [3H] GMP into the acid-insoluble precipitate within 1 hour at 37°C and pH 8.0 is defined as 1 unit. |
Components
| Components No. | Name | 10625ES10 (10 KU) | 10625ES60 (100 KU) | 10625ES86 (2,500 KU) | 10625ES99 (100 MU) |
| 10625 | T7 RNA Polymerase GMP-grade (250 U/μL) | 40 μL | 400 μL | 10 mL | 400 mL |
Shipping and Storage
T7 RNA Polymerase GMP-grade products are shipped with dry ice and can be stored at -15℃ ~ -25℃ for one year.
Figures

Figure 1. Standard RNA was synthesized in vitro using T7 RNA synthesis kit.
The reaction was incubated in PCR instrument at 37℃ for 2h, and then purified by magnetic beads (Cat#12602). The yield result was analyzed by NanoDrop spectrophotometer as shown in Figure 1.

Figures 2. The transcription demonstration of different lengths RNA by T7 kit respectively in the electrophoretogram (Figures 2A), the capillary electrophoresis diagram (Figures 2B), and the chromatogram (Figures 2C)

Figure 3. Synthesis of capped RNA in vitro.
The reaction was incubated in PCR instrument at 37℃ for 2h, and then purified by magnetic beads (Cat#12602). The yield result was assayed by NanoDrop spectrophotometer as shown in Figure 3A. The integrity result was analyzed by capillary electrophoresis as shown in Figure 3B.
